259 | Sukhumvit 19 | 10110 | Bangkok | ประเทศไทย
The DevFlowStudio team transformed learning progress tracking. Our core objective: an intuitive, interactive visualization system for skill development. We aimed to empower learners with clear, actionable insights, boost motivation, and equip educators with robust monitoring tools. Our focus was converting complex learning data into engaging, digestible visual narratives, fostering continuous improvement.
To achieve these goals, we adopted a rigorous agile methodology, prioritizing user experience and iterative feedback. The process began with extensive requirements gathering and UI/UX design. Development proceeded in focused sprints, enabling continuous integration and testing. We maintained a data-driven approach, analyzing user interactions and performance metrics to refine features and optimize system efficiency for a scalable solution.
Integrating disparate learning data from various external platforms, each with unique schemas, was a primary hurdle. Our solution: a sophisticated, standardized data abstraction layer. This normalized incoming data, streamlining processing and ensuring data integrity. Maintaining optimal performance and real-time responsiveness was another complexity. We used advanced caching, optimized database queries, and WebSocket technology for instantaneous data push notifications.
Deployment of these dynamic skill development dashboards yielded remarkable results. We observed significant uplift in user engagement, with increased daily active users. Course completion rates improved by approximately 15%, linked to enhanced clarity and motivational feedback. Learners reported greater control over their educational journey, attributing sustained motivation to intuitive visualizations. Educators gained unprecedented insights, facilitating targeted interventions and personalized support.
This project underscores DevFlowStudio's capability in delivering cutting-edge solutions that impact user success. It showcased our team's technical expertise in complex data integration and advanced visualization, reinforcing our ability to overcome intricate challenges. This achievement significantly enhances our portfolio, solidifying our position as a leader in innovative educational technology and paving the way for future collaborations. It represents a vital step in our ongoing journey of growth and innovation.
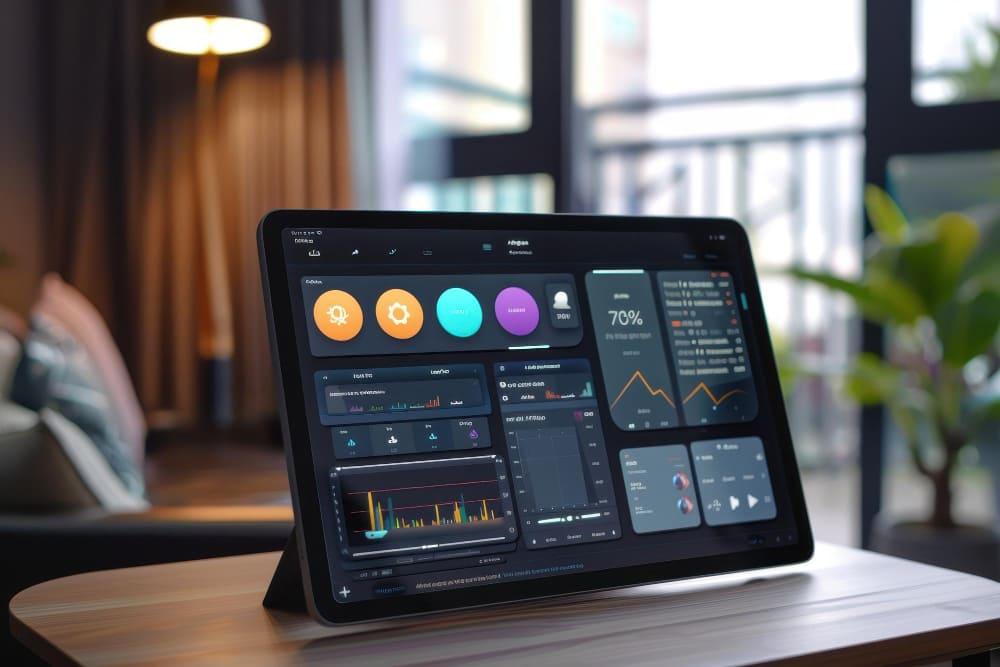
Our learners now have clear visual feedback on their progress, thanks to these dynamic dashboards. It's significantly boosted motivation and completion rates.
Education, Learning, Visuals
At DevFlowStudio, we believe every data set holds a unique story waiting to be told. Our creative team excels at transforming complex information into visually stunning and intuitively interactive dashboards, sparking new perspectives and driving innovative solutions for your business challenges.