


10.29.2025
259 | Sukhumvit 19 | 10110 | Bangkok | ประเทศไทย


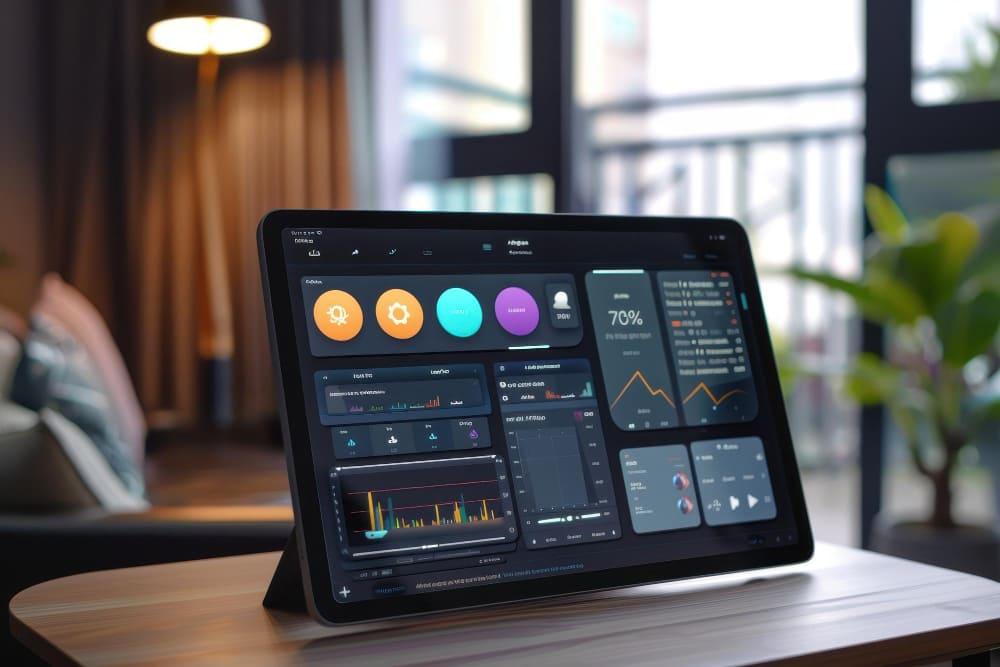
DevFlowStudio provides bespoke embedded analytical dashboards, turning complex datasets into intuitive visualizations. We help you understand user journeys, optimize learning paths, and boost platform engagement.
Visualize every interaction, click, and journey within your platform to understand user behavior patterns.
Monitor individual and cohort learning dynamics, identifying strengths and areas needing attention for educational platforms.
Uncover how users interact with your content, features, and community, fostering deeper connections.
DevFlowStudio specializes in creating bespoke embedded analytical dashboards that transform your data into a powerful narrative. We empower organizations to see, understand, and act on critical insights.


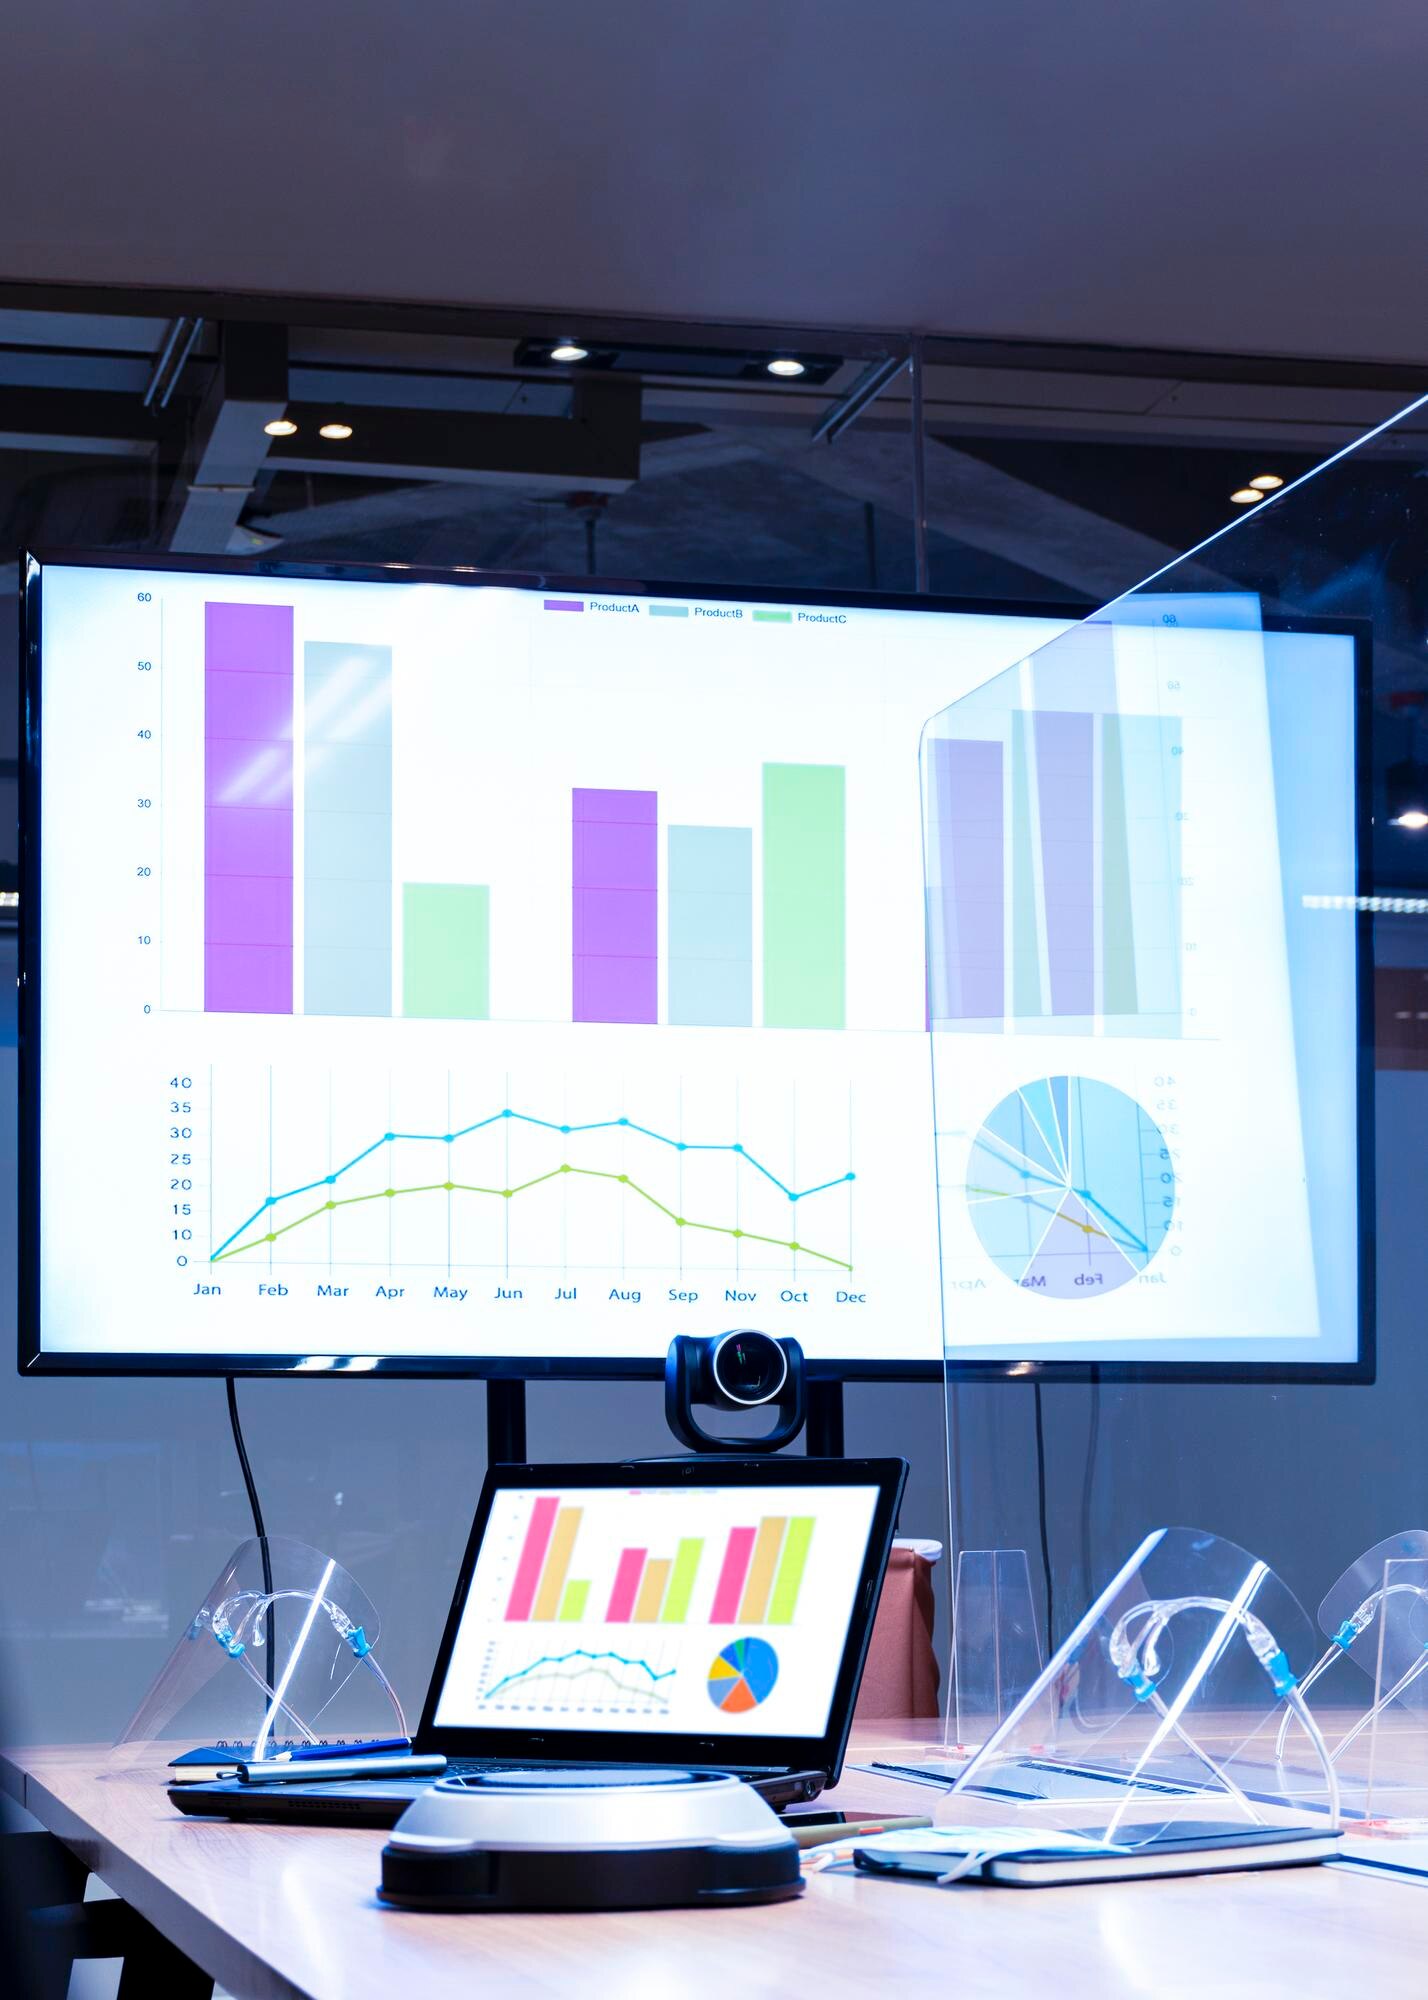
DevFlowStudio designs and implements embedded analytical dashboards that visualize user activity, track learning dynamics, and measure engagement, providing a clear window into your operations.
We partner with diverse sectors, providing tailored embedded analytical dashboards that bring clarity to user activity, learning paths, and engagement metrics across various domains.

Visualizing student progress, course engagement, and learning efficacy for enhanced educational outcomes.
Monitoring user feature adoption, session duration, and retention to refine product development and user experience.
Tracking content consumption, audience interaction, and engagement trends for optimized content strategy.
Explore a selection of our embedded analytical dashboard projects, showcasing how DevFlowStudio transforms complex data into intuitive, actionable visualizations for diverse client needs and sectors.
"At DevFlowStudio, we transform complex data streams into elegant, interactive dashboards. Our solutions illuminate user activity, learning paths, and engagement, empowering smarter, data-driven decisions for your future."
DevFlowStudio offers comprehensive services in embedded analytics, from initial data strategy and dashboard design to seamless integration and ongoing support, ensuring your data always tells a clear story.
Empowering Decisions with Integrated Analytical Dashboards In today's data-rich environment, the ability to quickly...
View MoreSeamless Data Visualization: Tailored Analytical Dashboards DevFlowStudio specializes in developing and integrating bespoke...
View MoreEmpowering Your Business with Integrated Analytics At DevFlowStudio, we understand that data is the lifeblood of modern...
View MoreEmbedded Analytics Solutions by DevFlowStudio At DevFlowStudio, we specialize in empowering your applications with...
View More
We begin by understanding your unique data challenges, objectives, and desired insights to define a clear visualization strategy.

Our team crafts intuitive dashboard layouts and builds robust, interactive visualizations tailored to your specific data sources.

We seamlessly embed dashboards into your platforms and empower your team with the tools to interpret and act on the new visual insights.
DevFlowStudio has consistently expanded its capabilities, helping more organizations gain profound insights from their data and fostering a culture of informed decision-making.

Stay informed with DevFlowStudio's latest insights in data visualization, embedded analytics, and user engagement strategies. Subscribe to our newsletter for expert articles, case studies, and industry trends delivered to your inbox.